
Along a path of jades
About
Along a path of jades is a photographic spatial mapping project that explores the subtleties in reaching urban green space. Focusing on present conditions in Mexico City, it combines distance analysis with photo-documentation to uncover patterns of difference that are shaped by socioeconomic and historical forces. These differences are presented in a series of fast-motion bitmap images that narrate a typical walking path to each of the 16 areas undergoing renovation as part of the city government program Sembrando Parques, or “planting parks.” Much like jade – a viridescent gemstone believed to be medicinal by varied traditions – the availability of urban green space, with its many associated health benefits, is not always easy to come by.
[See Project Info below for an in-depth overview and analysis]
Ninoyolnonotza, campa nicuiz yectli auiacaxochitl? ac nictlatlaniz? – Cantares mexicanos, Miguel León-Portilla
I speak from the heart, where shall I pick beauteous, fragrant flowers? Who shall I ask? – Mexican songs, Miguel León-Portilla
Photodocumentation
North Mexico City

Metro Auditorio to entrance of Bosque de Chapultepec (900m)
Metro Insurgentes to the center of Avenida Chapultepec lineal park (900m)
Metro Sevilla to Metro Chapultepec along Avenida Chapultepec lineal park (600m)
Metro Chapultepec to Bosque de Chapultepec (450 m)
Metro Deportivo Oceanía to Bosque de San Juan de Aragón (550m)
Metro Bosque de Aragón to Bosque de San Juan de Aragón (110m)
Metro Villa de Aragón to Bosque de San Juan de Aragón (184m)
Metro Ricardo Flores Magón to Gran Canal Lineal Park (700m)
Metro Eduardo Molina to Gran Canal Lineal Park (800m)
Metrobus Potrero to entrance of Sierra de Guadalupe (750m)
Route 18.75 Forestal Bus Stop to Deportivo EL Vivero (1km)
South Mexico City
Metro UAM-I to Corredor Eje Sur (2.1km)
Metro Constitución de 1917 to Periférico Oriente Lineal Park & Parque Cuitláhuac (2.8km)
Metro Cerro de la Estrella to Cerro de la Estrella (1.5km)
1.5km
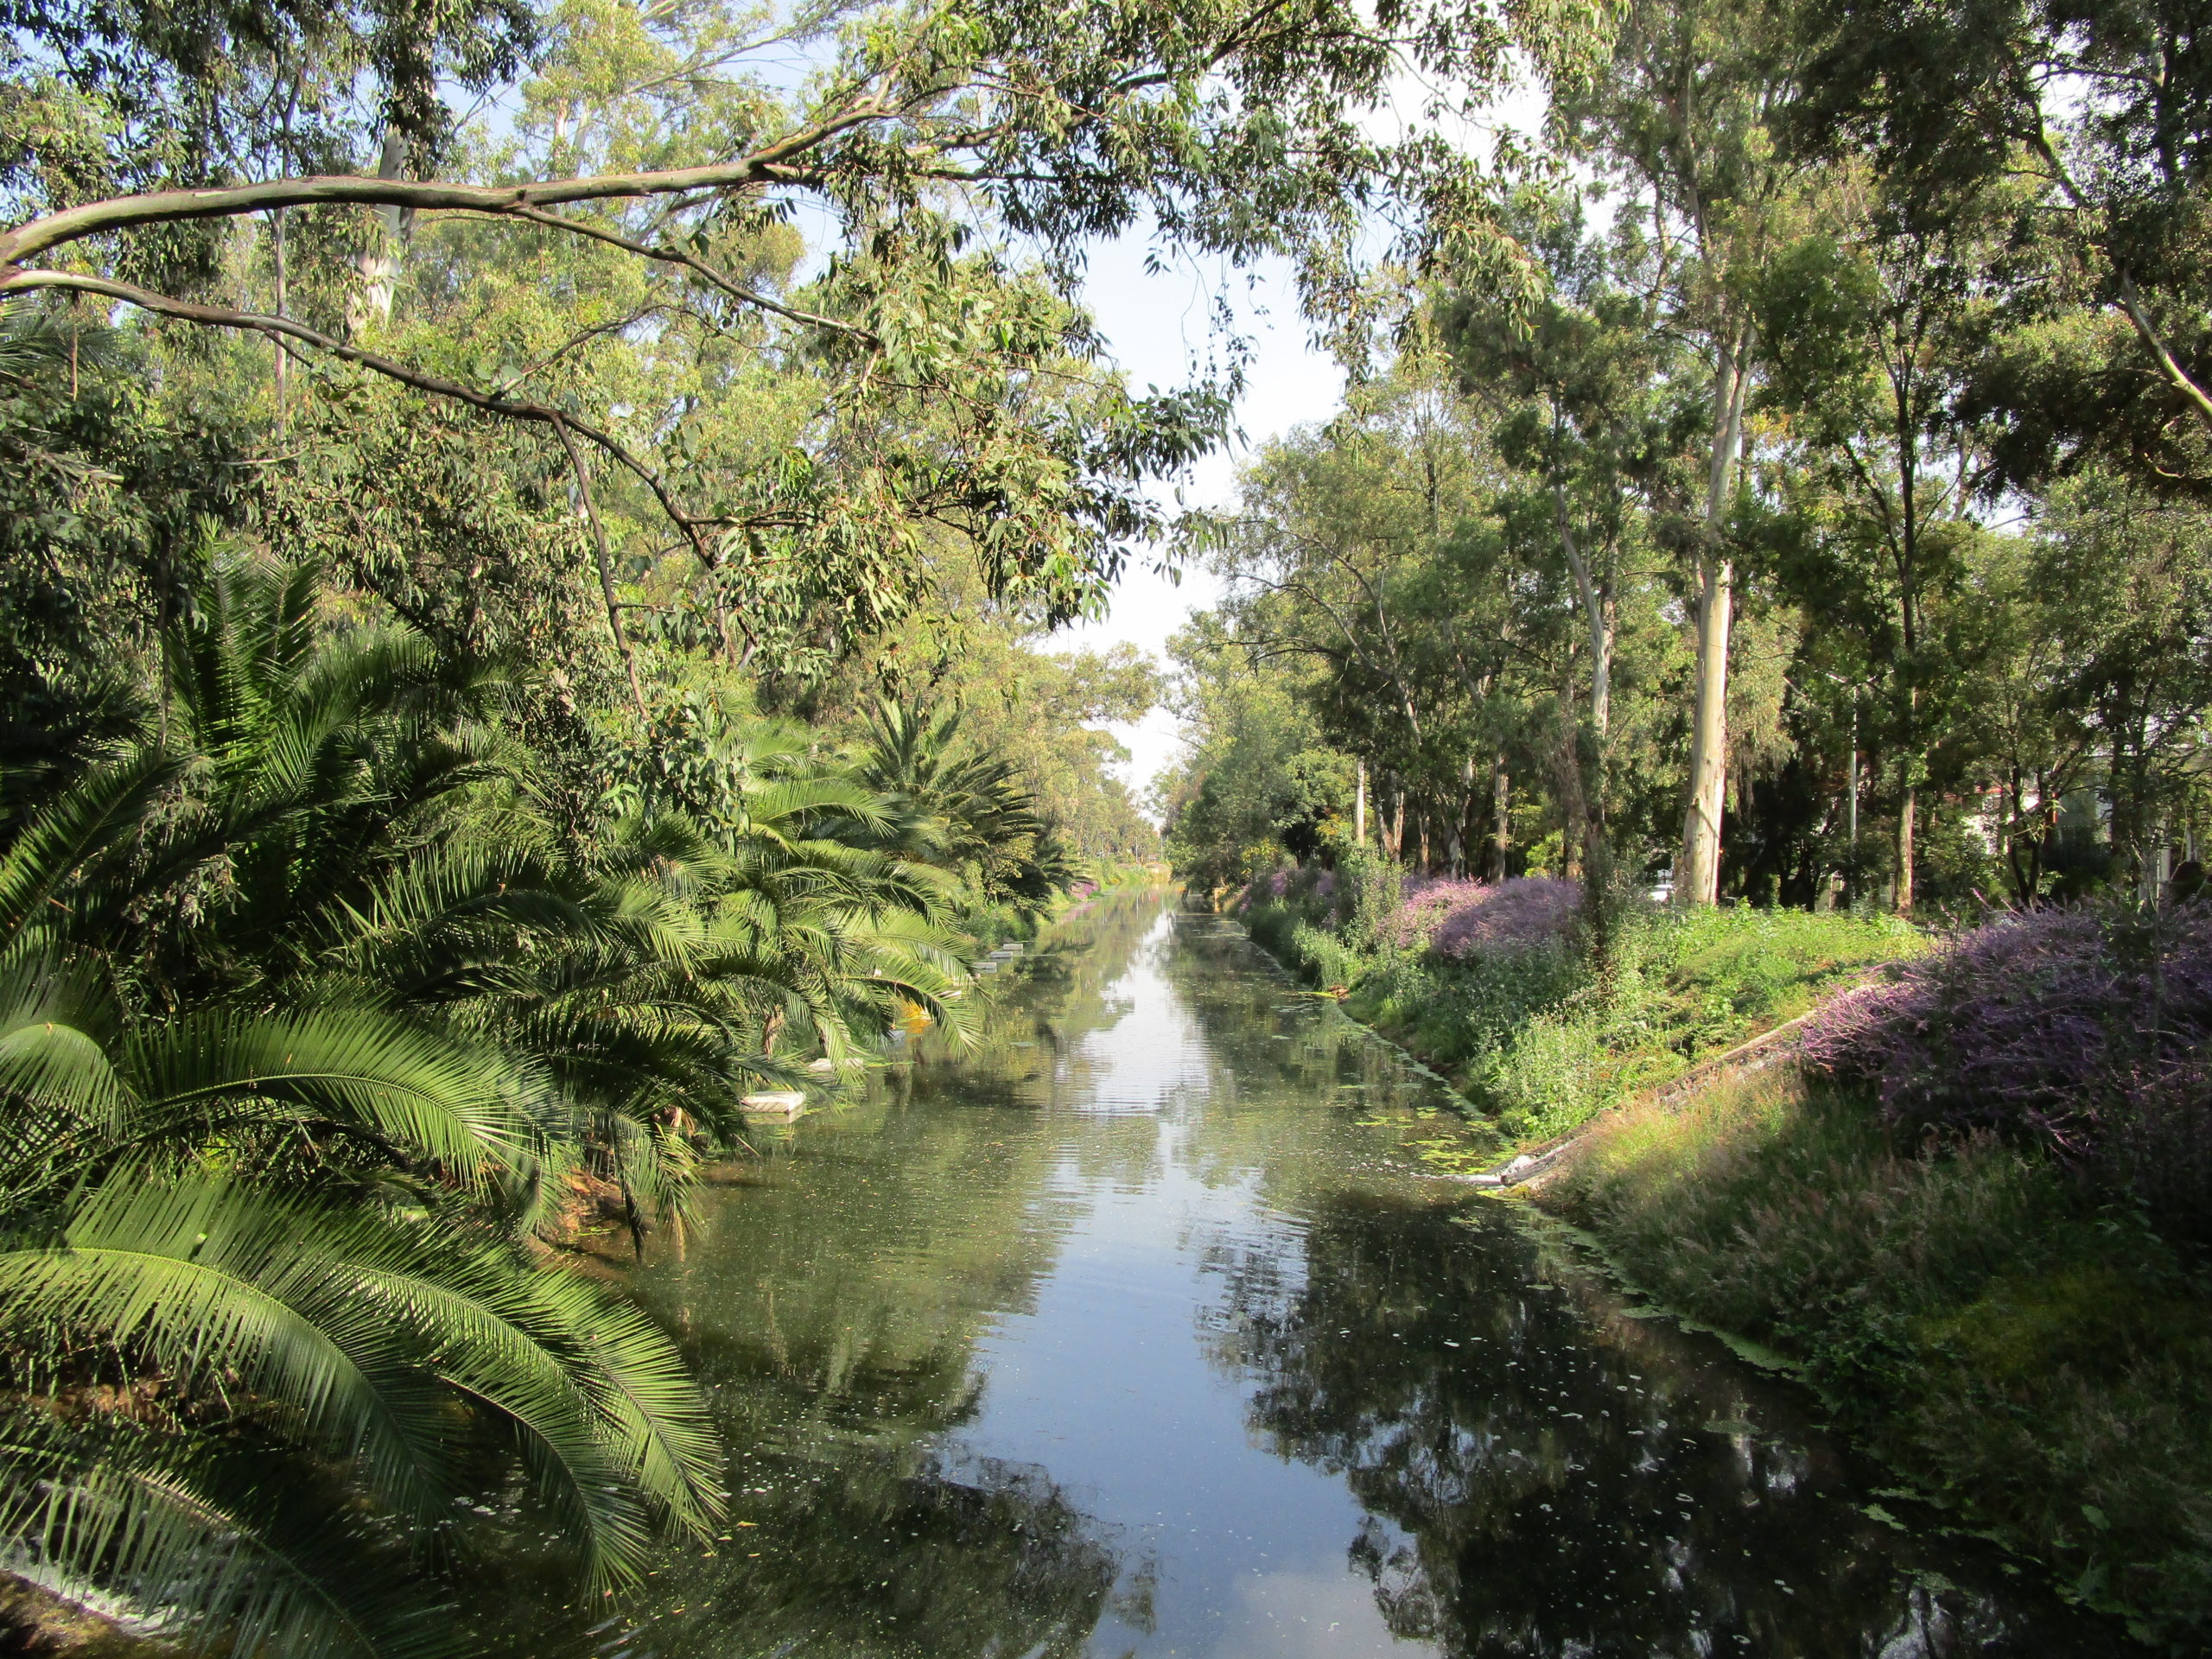
Metro Mexicaltzingo to Canal Nacional (1.12km)
Metro Periférico Oriente to Parque Ecológico Xochimilco (800m)
Metro Universidad + southbound bus to Parque Imán (378m)
Metrobus Fuentes Brotantes to Parque San Fernando (1km)
Metro Universidad + Bosques-bound Bus to Parque Ecológico CDMX (400m)
Metro Santa Marta + informal passenger van route to Sierra Santa Catarina (600m)
Project Info
Introduction
For the roughly 21 million people that live in Mexico City, reaching an urban green space is not always easy. This is especially the case for people that rely on public transit as their primary mode of transportation. More than that, the health benefits associated with urban green space are becoming increasingly known, such as its potential to improve mental health and perceived general health.1 In order to meet this public health need, the local government launched an ambitious city-wide initiative in 2019 named Sembrando Parques (SP), or “planting parks,” with the aim of renovating and expanding sixteen existing public parks and recreational areas.2
Several of these parks are perhaps the most iconic in the city, while the other lesser known parks had fallen into varying degrees of disrepair and neglect over the years. Taken together, the proposed renovation and services of these parks will benefit an estimated 6.3 million people. Although the extent and distribution of the SP areas spreads out across the northern and southern halves of the city, there is a clear divide in terms of accessibility and quality of experience.
In this visual study, I problematize this divide and attempt to uncover the differential patterns that shape the general landscape of transit-to-park experiences. Utilizing mapping software and photo-documentation, I investigate the relationship between spatial distance, aesthetic quality, and socioeconomic factors that characterize a typical walking route to each of these areas presently.
History of Green Spaces in Mexico City
Through the centuries, the planning of green spaces in the Greater Mexico City Metropolitan Area, known to its indigenous founders by the Nahuatl name of México-Tenochitlan, has been inconsistent. The reasons for this are many. Following Spanish colonization in the 16th century, as in the rest of Latin America, large-scale development was planned around centrally located plazas, or zocalos.3 Many of these were connected by crisscrossing avenues. Despite the numerous plazas, tree cover was relatively sparse and hardly a priority of the time. In contrast, the 18th century brought about a recognition of the importance of vegetation for the purposes of public health and sanitation.
Towards the late 19th century, federal agencies such as the “Commission for Beautification” were established under the Porfiriato, a historical period led by the presidency of Porfirio Diaz.4 These agencies were tasked with implementing new paradigms that placed “beauty, sanitation, and comfort” at the forefront of urban projects. Lamentably, a great majority of the projects to increase urban vegetation during these years were concentrated in the wealthier enclaves of the city to the detriment of the marginalized. By 1901, only 2 percent of the territory within the city limits was allocated to green space. Following the Mexican Revolution of the 1910s, Mexican urbanists put forth a vision of the city that rippled from an unprecedented international wave of urbanism to solve complex problems concerning sanitation and well-being. This included planning codes which required that 15 percent of all newly integrated neighborhoods be allocated to green space. Yet, the systematization of green spaces would remain quite fragmented, largely due to poor planning, rapid urbanization, unequal zoning practices, and the mismanagement of products and services.5
What is more, the patterns of urban land use would continue to privilege property development and the construction of roadways. Even as late as the 1970s, the ornamental value ascribed to green space relegated them to a secondary, post-development priority.
In recent decades, the government of modern-day Mexico City, with its sixteen boroughs, has embarked on a path towards sustainability. This is evident in the “Environment and Climate Change Program of Mexico City 2019-2024,” which outlines seven priorities for urban land use that include revegetation, as well as integrative city mobility.6
In parallel, the Sembrando Parques initiative (see Map 1; see Figure A), a program by the Secretariat of Works and Services of Mexico City, comprises 70 million US dollars in federal funding, 1,199 hectares, and the incorporation of 175,410 trees, bushes, and plants at completion.
Map 1: Areas of the Sembrando Parques Program

In order to reduce private transport, the Secretariat of Mobility of Mexico City is expanding the existing public transit in the following ways:
-
- Construction of a total network length of 100 km exclusively for public transportation
- Expansion of the existing metropolitan and bus rapid transit system
- Introduction of low-emissions transit in neighborhoods with high urban marginalization.
The above programs are among the many actions the local government is taking to align itself with the commitments of the New Urban Agenda.7 This agreement, adopted at the United Nations Conference on Housing and Sustainable Urban Development on October 20, 2016, in Quito, Ecuador, provides a road map on which to base sustainable urban development. Specifically, the commitment to equal opportunity and the promotion of “safe, accessible and green public spaces” is brought to bear on the city’s action to improve existing infrastructure and services.
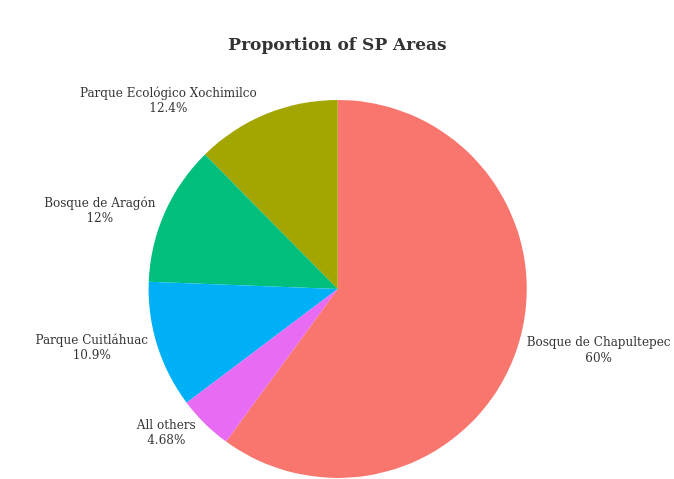
Figure A
According to the Index of Urban Equity of the World Resources Institute, the upper fifth of the Mexico City population on the social development score have as much as six times more opportunities to access public spaces than the most vulnerable fifth.8
By the same token, the highest fifth of the population have nine times more opportunities to access massive transit stations than the most vulnerable fifth. Against this startling panorama of social and environmental inequality, the local government is making strides to improve the neighborhoods and livelihoods of Mexico City residents in an uphill battle towards achieving its long-term, sustainability goals.
The Public Transit System Today
In April of 2019, as part of the local government’s strategy to expand public transit, the city introduced a new system called Movilidad Integrada de la Ciudad de México, or “Integrated Mobility of Mexico City.”9 Overlain on the existing transit network, this program essentially joined the various methods of public transit in the city in order to provide passengers with a multi-modal yet integrated experience . In addition, a universal transit card is now in operation. Prior to this, different payment and ticketing methods were in place, including cash and paper tickets.
Map 2: Network of the massive transit systems
![]()
Safety, Inequality, and Ridership
It should be noted, however, that while the universal transit card is accepted by all of the transit modalities pictured in Map 2, there is still widespread use of informal bus and passenger vans, or combis, which only accept cash payment.10
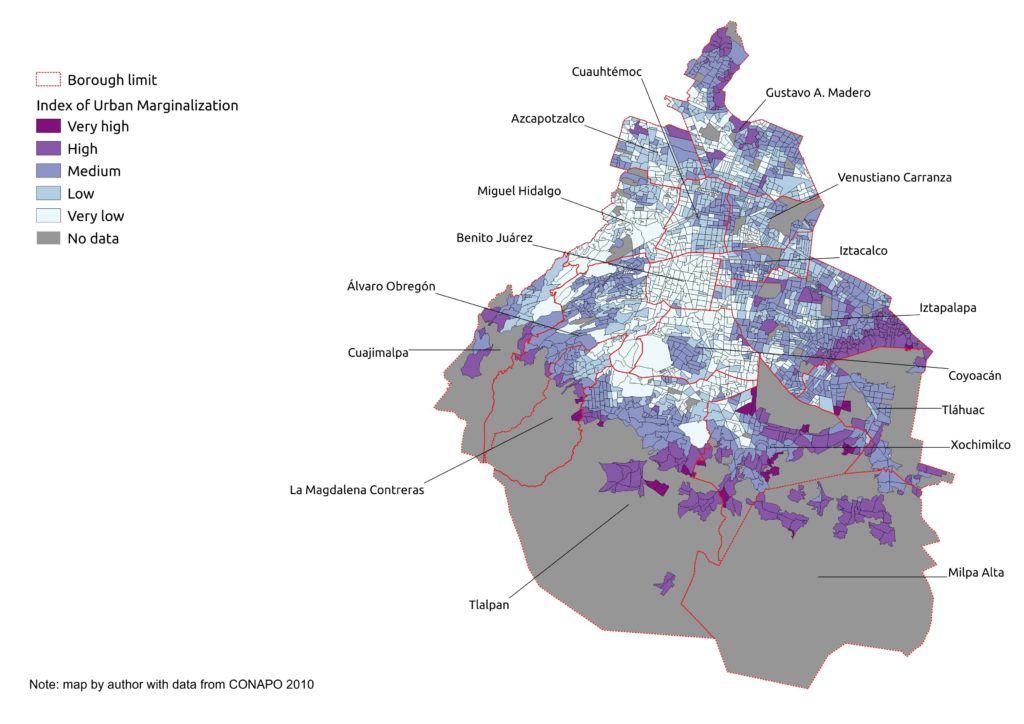
Moreover, informal modes of transit are especially common in the boroughs of the city marked by the highest rates of urban marginalization, such as Iztapalapa, Tlahuac, and Xochimilco (see Map 3). In the rural borough of Milpa Alta, none of the integrated mobility systems provide service. For a great majority of Mexico City passengers, a typical journey will require a combination of various modalities, that is, it often times involves riding a passenger van to the nearest metro station in order to connect with the massive transit system.
Map 3: Urban marginalization per neighborhood
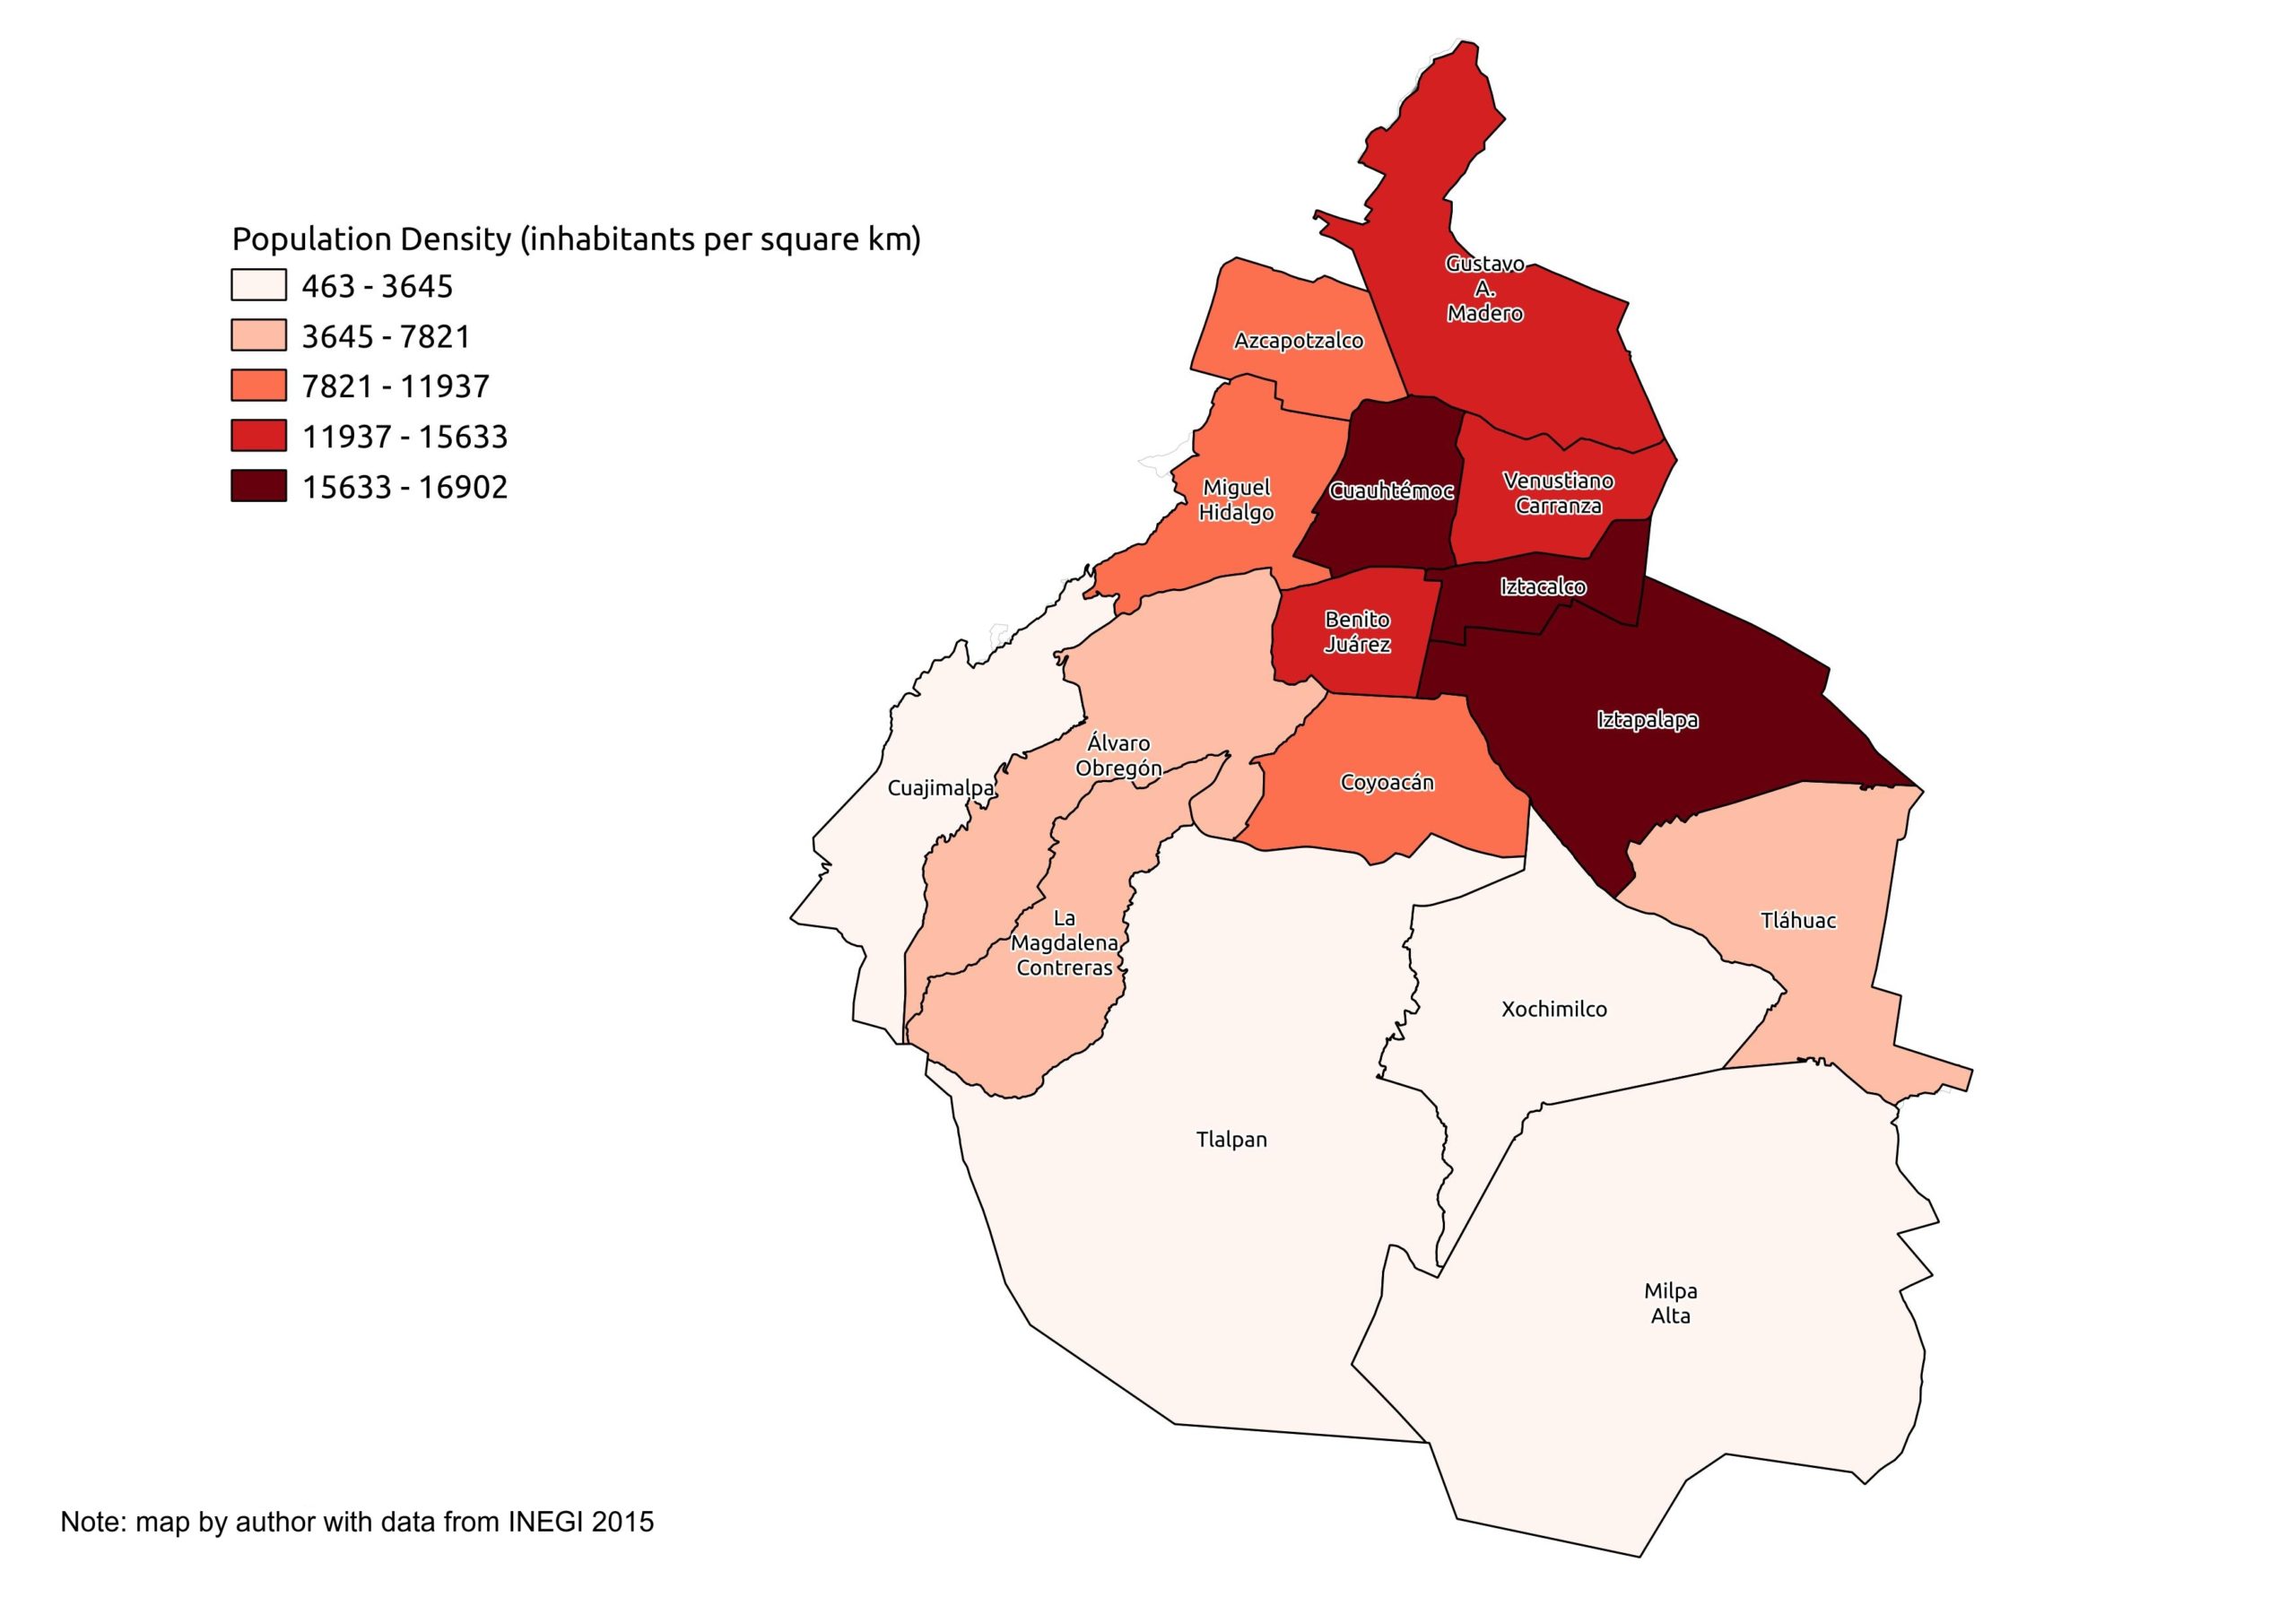
In terms of passenger experience, the integrated mobility system and the fragmented nature of the informal transit routes continue to create stark contrasts. The borough of Iztapalapa with some of the highest ridership of informal public transit is also among the most densely populated (see Map 4). There is also the concern for safety, with 90 percent of Mexico City inhabitants expressing a perceived lack of safety on public transit.11
As of September 2020, 2,392 robberies on public transit have been recorded in Mexico City, with 55% of those incidents taking place on the informal public transit network. To increase public transit ridership, a significant reduction in crime will be necessary.
Map 4: Population density per borough
In percentages, about 67.98 percent of public transit ridership occurs on the informal public transit network.12 This amounts to about 10 million trips made by buses and passenger vans per day. The second most utilized modality is the metro system, with 16.8 percent of riders relying primarily on this form of transit. The rest of the share of ridership is distributed as follows: taxi (9.7%); metrobus/mexibus (5.1%); suburban buses (5.3%); motorcycle taxis (1.1%); and others (2.6%). These numbers indicate that the existing integrated mobility system continues to fall short of providing equitable transit in the city.
Methodology
Data Collection
The majority of the city data in this study was sourced from the open database made available to the public by different agencies of the Government of Mexico City under a CC BY 4.0 license.13, 14, 15 Specifically, I focused on data pertaining to green space, public transit, ridership, urban marginalization, population density, and zoning. Regarding cartographic data, these were sourced from OpenStreetMaps made available by © OpenStreetMap contributors under the OdbL license. The data was accessed from May to July of 2020.
In general, my main selection criteria was that the data had to be most closely related to transit-to-park experiences. Most importantly, these experiences are meant to underscore the progress, or lack thereof, in achieving transit-oriented development on a large scale. Certain data related to urban marginalization were considered but ultimately excluded from the analysis, i.e. the social development index which takes into account variables beyond the scope of this study. Data for ongoing expansion projects were also excluded.
Analytic Approach
To carry out the spatial analysis, I first assessed the spatial distances of the existing massive transit system in relation to the Sembrando Parques (SP) areas, as opposed to the more localized informal network. This was done in QGIS, an open-source geographic information systems. I utilized the distance-to-nearest-hub, shortest-path, and distance matrix algorithms to measure approximate distances from an SP area to the nearest or constellation of nearest public transit stations. In addition, the point density algorithm was applied to the massive transit systems (i.e. metro and rapid bus transit) in order to measure station density across the metropolitan area. Regarding metrics, a walking buffer threshold of 800m was placed around each SP area; this action was based on studies of the average distance city residents around the world are willing to walk to the nearest green space.16 Secondly, where massive transit was limited or non-existent, I joined the open data regarding the informal public transit to the massive transit system.
For the visual portion of this study, I utilized the results of the spatial analysis to plan a visit to each of 16 SP areas, which were divided into 7 day excursions in total. Since I am concerned with the differences in landscape along each walking route, I implemented a photodocumentation strategy inspired by Raven-Ellison and Askin’s project “Urban Earth.”17 This project took place in three cities, namely London, New Delhi, as well as Mexico City. Their strategy involved taking landscape photographs in 10-step intervals of a transversal journey across each city, beginning and ending at the diametrically-opposed rural peripheries.
For my study, I also took photographs in 10- to 20-step intervals from the metro/metrobus/informal bus station to the entrance of the SP area. In order to simulate a typical walking route, I relied on the suggestions provided by Google Maps for the exact routing. I should note that while I followed most of these routes in their entirety, there were certain real-world conditions, inaccurate data, and local knowledges that redirected my trajectory.
Observations
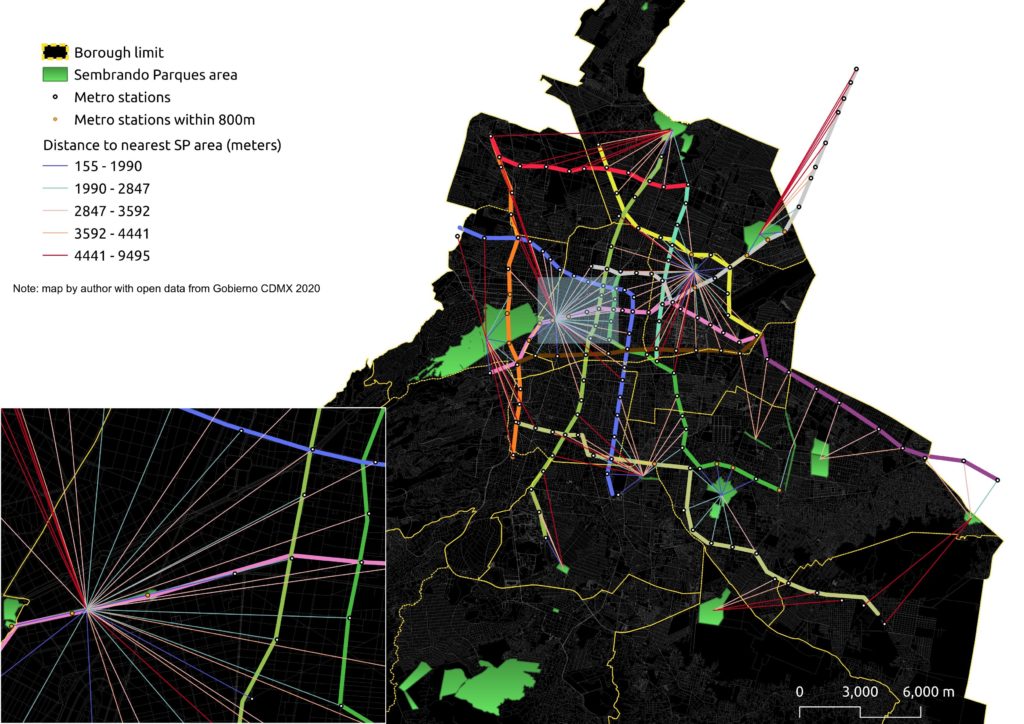
Beginning with the results of the spatial analysis, the distance spokes in Maps 5 and 6 give approximate distances of the constellation of nearest metro/metrobus stations to each SP area. I should note that the distances do not take into account actual route distances, but rather measure superficial, lateral distances. As we can see, the highest concentrations are located in the northern half of the city.
Map 5: Distance from SP area (hub) to nearest metro stations
Map 6: Distance from SP area (hub) to nearest metrobus stations
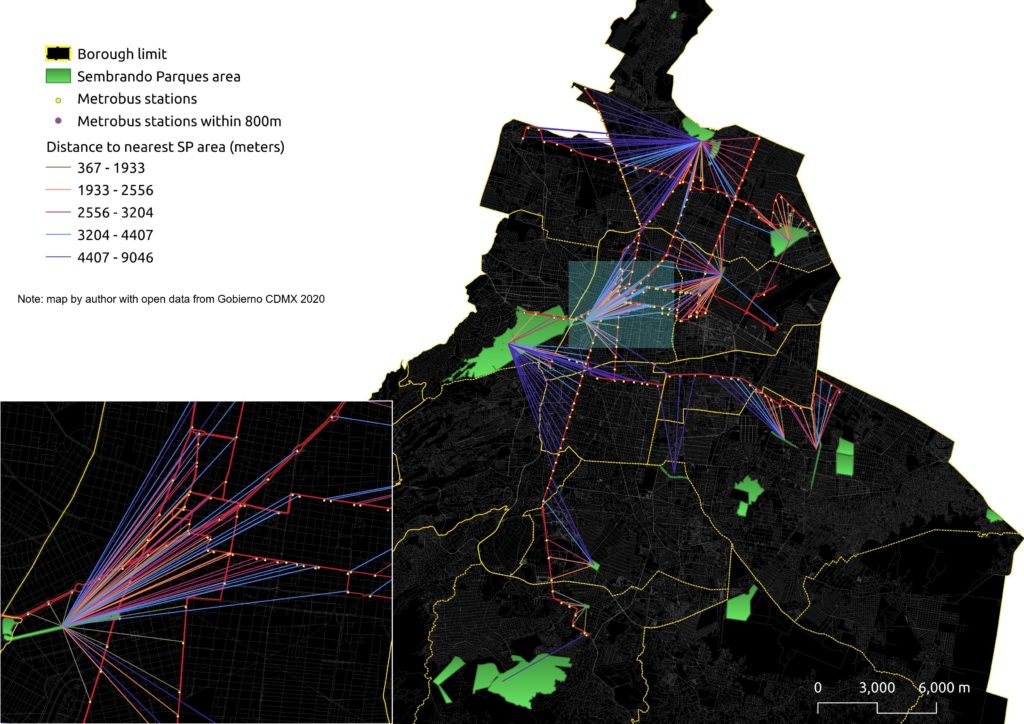
The shortest paths between station-and-SP area combinations are presented in the bar graph below (Figure B). To note, bars with more than one segment represent multiple stations within an optimal distance, i.e. 800m or less. For lineal parks, such as Avenida de Chapultepec, individual segments might be higher than 800m since they account for the distance to the approximate center of the park from a clearly marked entrance.
Figure B
Final Thoughts
From the observations, it is evident that the majority of the major transit hubs in the north of Mexico City are correlated with shorter distances to some of the largest and most centrally-located parks. This is seen for SP areas such as Bosque de Chapultepec, which has one dedicated metro station only 400m from the main entrance along with two other stations nearby. To contrast, Cerro de la Estrella is about 1.5km away from the eponymous metro station. While the argument can be made that the SP areas further away from massive transit stations can be reached via informal transit networks, this raises the question of feasibility for visitors unfamiliar with a particular borough. For the lesser known parks, the need to seek out local knowledge and directions from strangers becomes necessary. On this point, it is likely that in their planning, the parks and recreational areas included in the Sembrando Parques program are not intended to possess the same inherent degrees of community reach. However, this only brings up the question of the quality and quantity of green spaces afforded to different boroughs across socioeconomic lines. Furthermore, the touristic cache and affluence surrounding the SP areas with greater massive transit connectivity is perhaps one strong and unexamined determinant of quality.
Other factors, such as safety reputation, can also come into play in determining a potential visitor’s decision to make the journey to one of the SP areas. Those that are located in the much-maligned boroughs to the south-east of the city might be considered less favorable options as compared with their centrally-located counterparts in the northern half. To address the issue of safety, the city has begun to construct Senderos Seguros, or “safe trails,” that provide heavily-monitored, vegetated walking paths in neighborhoods with high rates of crime. Along these lines, one possible solution to consider is the creation of green-and-secure corridors that connect massive transit stations with SP areas and other significant green spaces. This would not only provide a measure of safety for park-goers, but would also fall in line with the international rise of wildlife corridors which mitigate the negative effects of the built environment.18 Instead of killing two birds with one stone, perhaps it’s time to put down the first stone to create an environment that allows both birds to thrive.